Financial market pressure as an impediment to the usability of regulatory capital buffers
Published as part of the Macroprudential Bulletin 11, October 2020.
Macroprudential and supervisory authorities reacted to the coronavirus (COVID-19) crisis through a set of capital relief measures to support bank lending to the real economy. Yet, banks may be unwilling to use their capital buffers, constraining the effectiveness of the measures. Indeed, banks did not fully reflect the capital relief measures in the target CET1 ratio they announce to investors. Pressure from financial markets could be a key explanatory factor: bondholders may require banks to maintain higher capital ratios to reduce default risk, while shareholders may pressure banks to continue dividend payments rather than to use excess capital to lend or to absorb losses. Despite these potential impediments, it may still be too early to draw a final conclusion, because losses have been prevented or delayed and lending has been supported by other broad-based policy measurers beyond prudential policies. So far, these policies have alleviated the need to reduce capital targets, while still being able to accommodate loan demand.
1 Introduction
Macroprudential and supervisory authorities adopted a comprehensive set of measures after the onset of the coronavirus (COVID-19) pandemic. The measures included temporary capital relief through lowering macroprudential buffers, allowing banks to fully use capital buffers, including Pillar 2 guidance (P2G), and adjustments to the composition of Pillar 2 requirements (P2R), recommendations to temporarily cancel dividends and share buybacks and to avoid procyclical effects when applying International Financial Reporting Standard (IFRS) 9[1]. All of these measures were aimed at avoiding a procyclical decline in bank lending to the private sector, which could further weaken macroeconomic dynamics.
The effectiveness of these measures critically hinges on banks’ willingness to adapt their internal capital planning to the temporary regulatory changes. To put it simply, the policy can only be effective if banks allow their regulatory capital ratios to decline in order to maintain loan supply and absorb losses following a capital relief. Such behaviour would indicate that the released buffers are (at least partly) “usable” to absorb losses without triggering deleveraging pressure.
Financial market pressure to maintain or even increase regulatory capital ratios can constrain buffer usability. In economic downturns or periods of high uncertainty, investors tend to avoid taking on additional risks, clearly preferring safe and liquid investments. Bondholders may require banks to maintain higher capital ratios to reduce default risk, while shareholders may pressure banks to continue dividend payments rather than using excess capital to lend or to absorb losses. Both shareholders and holders of AT1 bonds may also aim to avoid automatic restrictions on distributions being triggered. Market discipline in general is essential for financial stability and helps to avoid excessive leverage in the banking sector. Yet, market discipline tends to tighten during periods of financial stress, reinforcing deleveraging pressure. Its procyclical nature can thus be an impediment to an effective macroprudential policy.
Against this background, this article provides empirical evidence that market pressure is an impediment to the usability of regulatory capital buffers. It is structured in two parts. The first part investigates banks’ target Common Equity Tier 1 (CET1) ratio, using both changes in banks’ announced targets and their estimated determinants. The second part explores the impact of capital ratios on banks’ access to funding markets.
2 Did banks lower their target capital ratios as a consequence of regulatory capital buffer releases?
Banks typically choose to maintain a management capital buffer on top of the regulatory capital buffers and guidance. This management buffer serves to minimise the risk breach, which would have adverse consequences for their business. These adverse consequences may include limits to capital distributions and management remuneration, limitations on banks’ ability to engage in profitable business opportunities, or the need to dispose of non-core assets[2]. In extreme cases, banks may even need to shrink core portfolios to address the breach of capital buffers and requirements. The sum of required capital (including buffers and P2G) and the target management buffer constitutes a bank’s capital target.
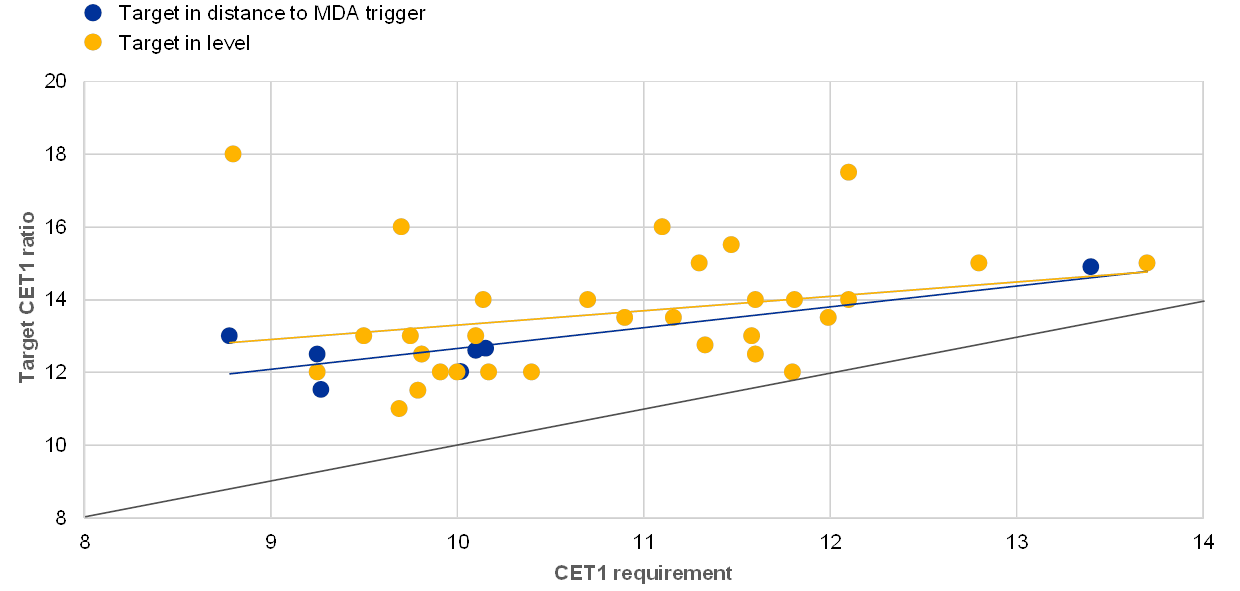
Listed euro area banks usually disclose their target CET1 ratios, allowing an analysis of how these targets evolved after the introduction of temporary capital relief measures by prudential authorities in the euro area.[3] The targets may take one or more of three forms: a target for the current year, a longer-term target, and a minimum target to be met over a specific period (typically two to three years). Not surprisingly, in general these targets exceed banks’ overall CET1 requirements. Many banks explicitly define their target in terms of a buffer on top of the CET1 capital threshold that triggers automatic restrictions on distributions – the maximum distributable amount (MDA) trigger. In this case, the buffer was set between 1.5% and 4% of risk-weighted assets in early 2020, just before the pandemic outbreak. The target is at least 1 percentage point above the MDA trigger for virtually all banks that set a target, and typically in a range of 1 to 4 percentage points above requirements (see Chart 1).
Chart 1
Capital requirements appear to be key drivers of target CET1 ratios
Banks’ target CET1 ratios and CET1 requirements before the COVID-19 crisis
(percentages)
Sources: Bank presentations and financial reports and ECB calculations.
Notes: CET1 requirements are defined as the MDA trigger, i.e. excluding P2G. The MDA trigger is as at 1 January 2020 and targets are as announced before March 2020. When targets are expressed as a range, the lower bound is used. MDA trigger levels are those communicated by banks to investors, which may marginally deviate from common reporting (COREP).
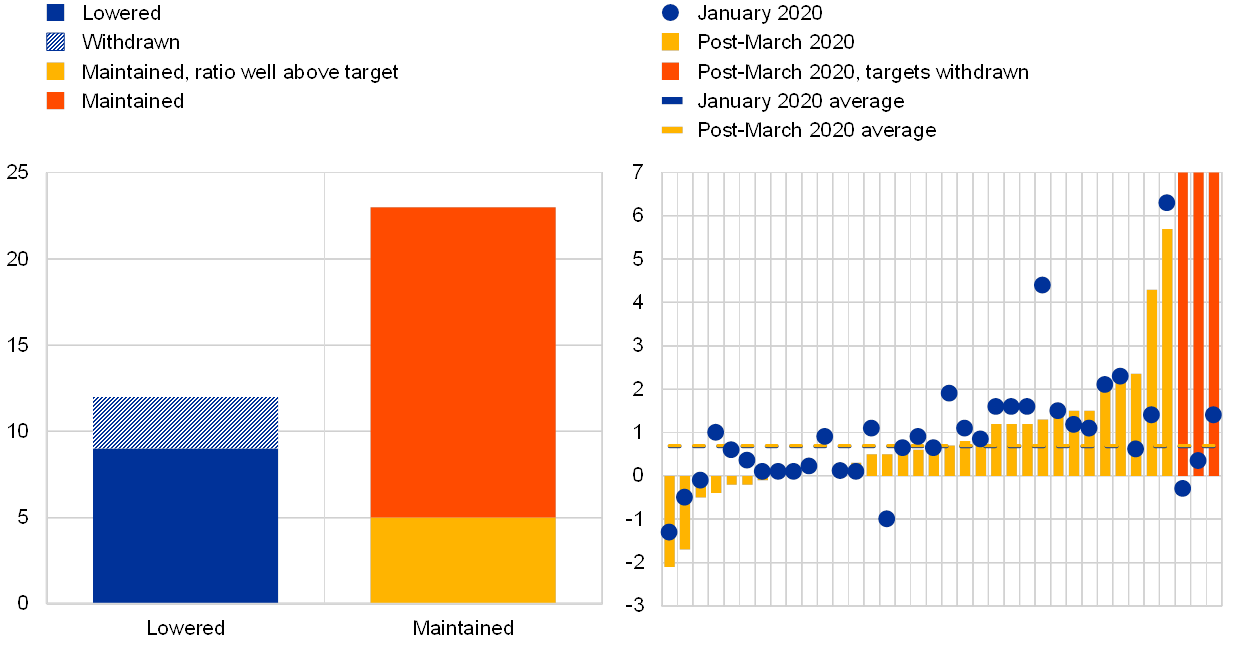
After the provision of COVID-19 related capital relief by prudential authorities in the euro area, targets were lowered temporarily, but not across the board. Three types of reactions were observed among the 35 banks which disclosed their new internal target for the regulatory CET1 ratio between April and September 2020 (see also Chart 2, left panel).
Chart 2
Mixed reaction of euro area banks to the temporary capital relief measures and lowered macroprudential buffers
Change in banks’ target capital ratios and distance to target after the COVID-19 outbreak
(left panel: number of banks; right panel: difference between actual and target CET1 ratios, percentage points)
Sources: Bank presentations and financial reports; comparison of targets announced before and after March 2020.
Notes: Right panel: difference between actual and target CET1 ratios (both as communicated by banks). When targets are expressed as a range, the lower bound is used; banks that announced a temporary decrease below their medium-term target are assumed to have lowered their target by 50 basis points. Ratios are deemed “well above target” when they are at least 1 percentage point above. Average distance between target and actual CET1 ratio are weighted by RWA, excluding banks that withdrew their targets.
First, around one-third of the sample either lowered (9 banks) or withdrew (3 banks) their targets. In most cases, these were mechanical adjustments, as their targets had been defined as a distance to the MDA trigger to start with, while the other banks which lowered their targets did so only in the shorter term, keeping medium-term targets unchanged. Importantly, the largest banks, which benefited most from the opportunity to partially cover their P2R with Additional Tier 1 (AT1) and Tier 2 (T2) capital, account for the major part of the group that lowered their targets.
Second, half of the sample (18 banks) maintained a target close to their actual CET1 ratio. All of these banks target a level of capital, as opposed to a distance to the MDA trigger. Uncertainty surrounding the future path and speed of buffer replenishment seems to explain at least partly the reluctance to lower internal targets in line with the release of regulatory buffers, with several banks voicing concerns about the risk of a quick re-introduction of regulatory buffers in their public reports.
Third, a few banks maintained their regulatory capital ratio targets, despite ample capital in excess of the internal target. For this set of banks, the target ratios already stood significantly above the requirements. In fact, several of these banks had distribution plans which would have led to a reduction in capital but were suspended in line with the regulatory ban on dividends.
Despite declining average targets for CET1 ratios, “excess capital” vis-à-vis the target remained largely unchanged. Overall, the average distance to target, weighted by banks’ total risk exposure amounts, increased only from 0.69 percentage points to 0.72 percentage points[4], as banks’ CET1 ratios declined in the first quarter of 2020, largely offsetting the impact of lower targets (see Chart 2, right panel). In addition, several banks entered the crisis with capital ratios below or close to their targets. These banks’ CET1 ratios may therefore remain below target even after a reduction in capital requirements, mitigating the effectiveness of the reductions. The available data for the second quarter indicate some recovery in capital ratios.
Banks intend to preserve or increase their distance to the MDA trigger. In their public communications, banks largely point out that they entered the crisis with a comfortable distance to their MDA trigger. Moreover, they indicate that they intend to keep or even increase this management buffer. Such behaviour suggests that, despite the supervisory and macroprudential measures introduced, banks remain rather reluctant to dip into their remaining macroprudential buffers. For a broader discussion and an estimation of the potential beneficial impact of the banking sector using their capital buffers on lending and on growth, see the articles entitled “Macroprudential capital buffers – objectives and usability” and “Buffer use and lending impact” in this issue of the Macroprudential Bulletin.
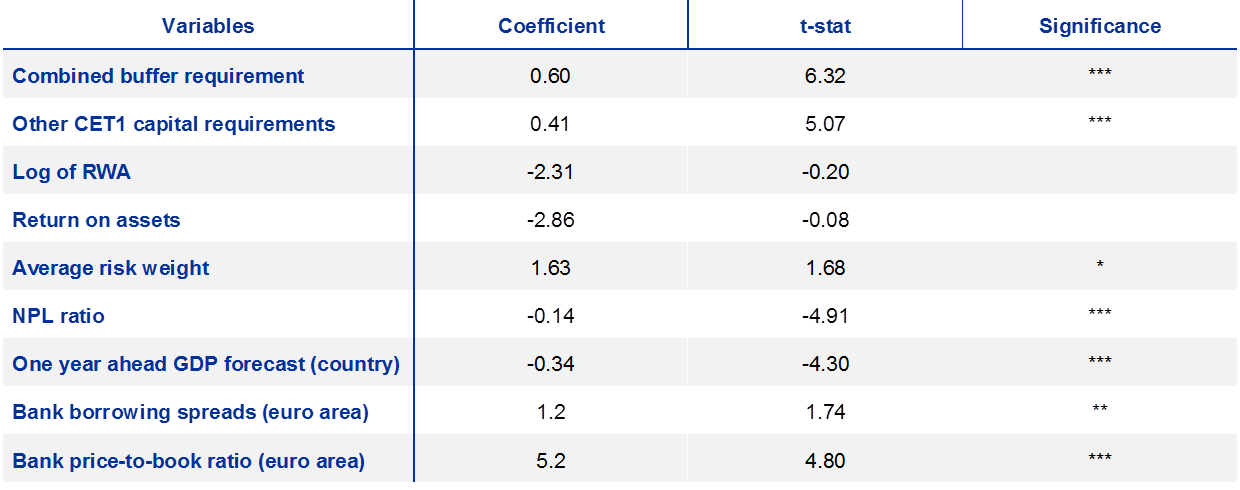
A complementary econometric analysis suggests an opposite impact of buffer regulation and market discipline. The underlying sample includes the announced targets of 39 large euro area banks in an unbalanced[5] panel from the fourth quarter of 2015 to the first quarter of 2020. Importantly, the key regressors are the bank-specific capital requirements (the combined buffer requirement and other CET1 requirements),[6] variables capturing the financial and economic environment (a measure of bank profitability, expected GDP growth and banks’ price-to-book ratios) and a set of bank-level and country-level structural characteristics.[7] This approach implicitly assumes that banks adapt their management buffer to the economic environment in order to manage the risk of unintended regulatory breaches.
Table 1
Capital targets rise with capital requirements and adverse macrofinancial conditions
Elasticity of bank target CET1 ratio to regulatory and macrofinancial determinants
Sources: ECB and ECB calculations.
Notes: Unbalanced panel of 41 banks between the fourth quarter of 2015 and the first quarter of 2020. “Other CET1 capital requirements” include Pillar 1 requirements, P2R and P2G, plus potential constraints from the leverage ratio, if more binding than risk‑weighted capital requirements. Bank borrowing spreads are defined as the spread between euro area bank bonds yields and German Bund rates for similar maturities, and computed following the approach of Gilchrist and Mojon (2016). Not reported control variables: intercept; “Size of the banking sector”, defined as the ratio of total assets of domestic banks to GDP, and “Banking sector concentration”, defined as the Herfindahl index of domestic banks by total assets. Pooled regression of unbalanced panel, robust standard errors (Newey-West). The R2 of the regression stands at 0.36. * denotes a p‑value <0.1, ** a p‑value <0.05, *** a p‑value <0.01.
The estimates suggest that macroprudential buffer releases should result in a significant decline in banks’ target ratios, but the immediate impact remains uncertain. Changes in combined buffer requirements and other regulatory requirements are found to have a positive, strongly significant and economically large impact on banks’ CET1 ratios (see Table 1), confirming that reductions of capital requirements result in declining target ratios for banks – a necessary condition for an expansionary effect of macroprudential policies. Nevertheless, this is not sufficient, because bank capital targets also react to other factors.
In adverse financial and economic conditions, banks seem to target higher regulatory capital ratios, which may counteract the impact of buffer releases. The regression analysis also suggests that banks increase their target capital ratios in response to expected slowdowns in economic growth and when their own funding conditions worsen. While such a reaction may counteract the impact of regulatory buffer releases, the accommodative impact of releases themselves remains intact. Without them, banks would actually target even higher CET1 ratios, possibly cutting credit supply further.
The regression analysis above finds that the macro-financial environment significantly affects banks’ target capital ratios. The next section therefore looks at financial factors.
3 Does financial market pressure play a role?
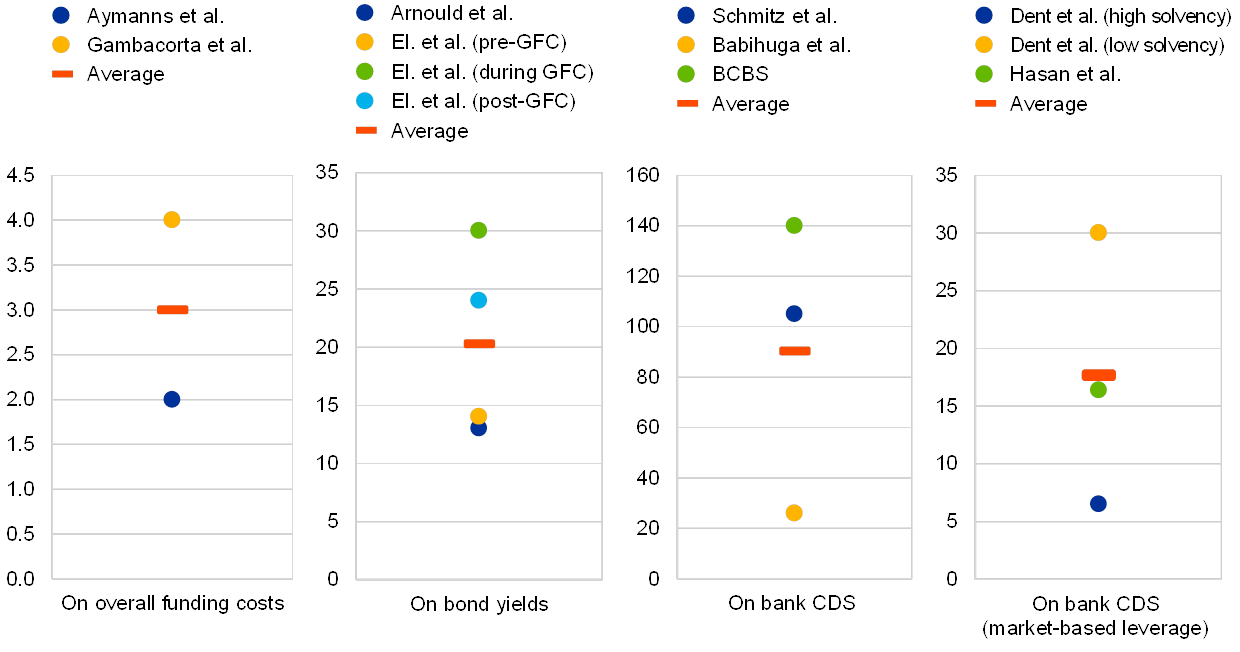
The empirical literature finds that lower bank solvency ratios typically lead to an increase in bank funding costs. Chart 3 shows estimates of the impact of a 1 percentage point decline in solvency ratios on banks funding costs based on existing empirical analyses.[8] It presents the effects on banks’ overall funding costs (first panel) and on senior unsecured bond market funding costs in the primary and secondary markets. Yields at issuance are used as a measure of conditions in the primary bank bond market (second panel), while credit risk premia embedded in bond yields, measured via CDS spreads, represent the secondary market (third and fourth panels). Overall, lower solvency ratios are associated with significant increases (statistically and economically) in banks’ external funding costs. Wholesale bond market costs exhibit a higher sensitivity than overall funding costs, which is not surprising given the importance of insured (and thus risk-insensitive) deposits in a bank’s overall liability structure. Consequently, financial market pressure on banks will vary with, among other factors,[9] their funding structure.
Chart 3
Lower solvency ratios are associated with higher funding costs
Meta-analysis of existing empirical studies: impact of a 100 basis point decline in solvency ratios on bank funding costs
(basis points)
Sources: ECB and ECB calculations.
Note: The chart summarises a meta-analysis of the funding cost impact of a 100 basis point decline in solvency ratios on overall bank funding costs (first panel), bank bond yields (second panel), bank credit default swap (CDS) spreads (third panel), and bank CDS spreads using market-based leverage as a solvency measure (fourth panel). The following empirical studies were included: Aymanns et al. (2016); Arnould et al. (2020); Babihuga and Spaltro (2014); BCBS (2015); Dent el al. (2017); Elyasiani and Keegan (2017), which also provided estimates for three sub-periods – before, during and after the global financial crisis (GFC); Gambacorta and Shin (2018); Hasan et al. (2016); and Schmitz et al. (2017).
Empirical evidence suggests that management buffers also matter for bank credit ratings. An ordered logit model for euro area bank credit ratings shows that lower management buffers on top of regulatory requirements increase the probability of receiving a lower credit rating (see Box 1 for details). Anecdotal evidence confirms that, all other things being equal, eroding management buffers would indicate a higher probability of default and increase the risk of rating downgrades.[10]
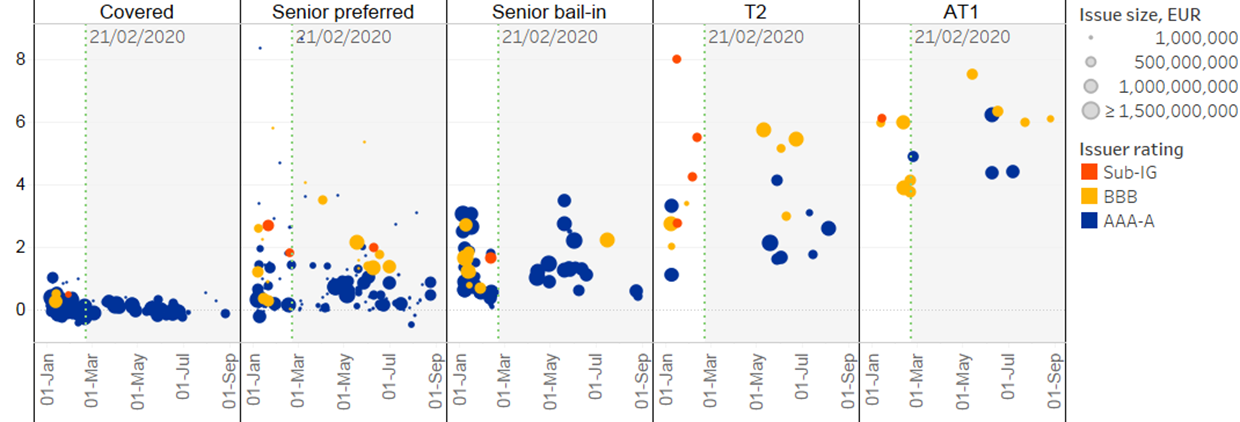
Lower ratings are not only associated with less favourable wholesale funding conditions but can also result in lost market access. The market reaction immediately after the outbreak of COVID-19 is a case in point. A surge in risk aversion and a flight to safety resulted in a temporary closure of the unsecured wholesale bond market. Despite the subsequent gradual normalisation, sub‑investment grade issuers – which successfully raised bond-market funding before the pandemic – have not yet been able to tap the market again (see Chart 4).[11] A possible reason for this may be that the same set of institutions were also lagging behind other banks in meeting their minimum requirement for own funds and eligible liabilities (MREL). Under such circumstances a rating downgrade can be a source of debt rollover risk, which banks may want to avoid irrespective of the introduction of liquidity measures – targeted longer-term refinancing operations (TLTROs) and pandemic emergency longer-term refinancing operations (PELTROs) – that provide funding certainty at attractive costs.
Chart 4
Sub-investment grade issuers have yet to regain market access since the onset of the COVID-19 pandemic
Bank bond issuance activity and pricing since the outbreak of COVID-19
(percentages)
Source: Dealogic.
Notes: Each dot represents a single deal. The chart shows the timing, issue size, yield at issuance and issuer rating.
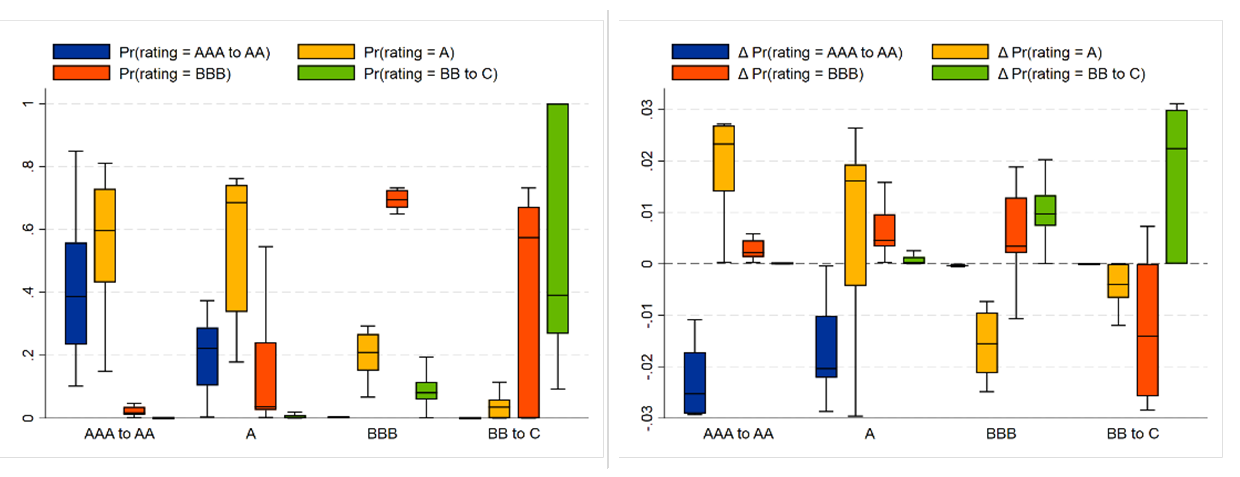
Overall, the currently expected declines in regulatory capital ratios are unlikely to result in a large wave of rating downgrades associated with a major worsening of banks’ access to external funding markets. Model simulations show that a 2 percentage point decline in management capital buffers, which would be similar to aggregate CET1 capital depletion in the central scenario of the ECB’s vulnerability analysis[12], would result in only a small increase in the probability of rating downgrades. The largest effect would be for AAA to AA-rated banks, with an increase in the probability of being downgraded to A of between 1.5 and 2.5 percentage points (see Chart 5, right panel).
Chart 5
A reduction of management capital buffers by 2 percentage points would only lead to a slight increase in the probability of a rating downgrade for most banks
Distribution of current model-based rating probabilities and changes in these probabilities if management capital buffers were to decline by 2 percentage points
(x-axis: current rating; y-axis: model-based rating probability, percentages (left panel); change in model-based rating probability, percentage points (right panel)
Sources: Fitch, SUP data, SDW and ECB calculations.
Notes: The distribution charts are based on 53 euro area significant institutions (SIs): 8 in the bucket “AAA to AA”, 16 in the bucket “A”, 13 in the bucket “BBB”, and 16 in the bucket “BB to C”. The model-implied probabilities of different ratings are based on an ordered logit model for bank credit ratings (see Box 1). Explanatory variables in the model are: management capital buffer, minimum bank capital requirement (P1 + P2R + P2G), pre-tax return on assets (ROA), non-performing loan (NPL) ratio, log of total assets, dummy for euro area SIs, 10-year government bond spread, government debt-to-GDP ratio, unemployment rate, bank credit-to-GDP ratio, and real GDP per capita. All else being equal, lower management capital buffers increase the probability of receiving a lower credit rating.
A further reason for banks’ reluctance to use their capital buffers could be related to the increased likelihood of MDA trigger breaches. Banks facing restrictions on distributions would be unable to pay dividends, which would hit their stock market valuations, and may need to restrict coupon payments on AT1 securities and cut some components of management remuneration.
In view of the weak internal capital generation capacity of euro area banks, the temporary nature of some regulatory measures undertaken to date and an unclear timeline for their phasing out reportedly act as a disincentive to using buffers now. Euro area banks already had low operating profitability before COVID‑19. Rebuilding capital buffers organically would therefore be challenging and could only be achieved very gradually, over a relatively long period. Such considerations may strengthen a latent unwillingness to use buffers to support the flow of bank credit in the current uncertain environment.
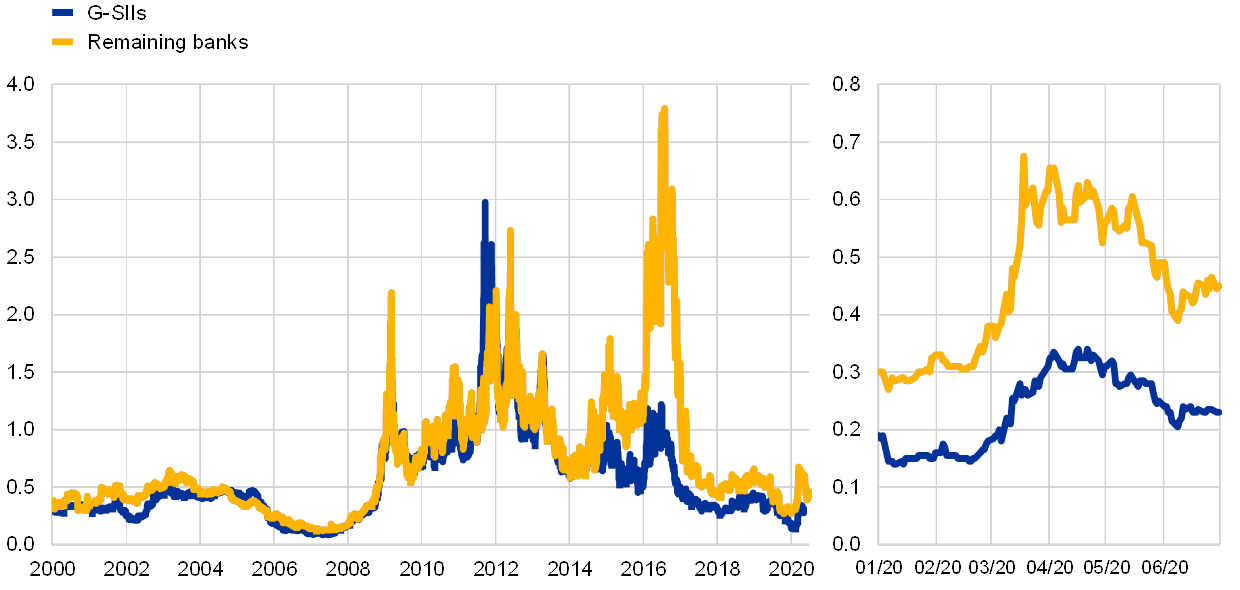
Chart 6
Market-based bank default probabilities have increased recently
Market-implied 1-year default probabilities
(percentages)
Sources: Bloomberg, Moody’s Analytics, and ECB calculations.
Note: One-year default probabilities (Moody’s EDF) from a structural default model for a large balanced sample of listed euro area banks.
Banks may be reluctant to dip into buffers not only to minimise the risk of breaching capital requirements and dipping into buffers, but also to avoid a further deterioration of market-based risk metrics. In the past such market-based risk metrics have been a strong predictor of bank distress[13] and are used by financial analysts for their investment recommendations and by rating agencies to cross-check their own rating models, ultimately affecting market funding costs. Chart 6 shows a notable increase in market-implied bank probabilities of default (PDs) during the COVID-19 pandemic, driven by the very low levels of the market-based leverage ratio (ratio of the market value of equity to total assets). Therefore, banks might refrain from dipping into buffers, as this could further elevate risk indicators and lead to higher funding costs or deteriorated access to certain parts of the unsecured wholesale bond market, as mentioned above.
Box 1
Estimating the impact of management capital buffers on bank credit ratings
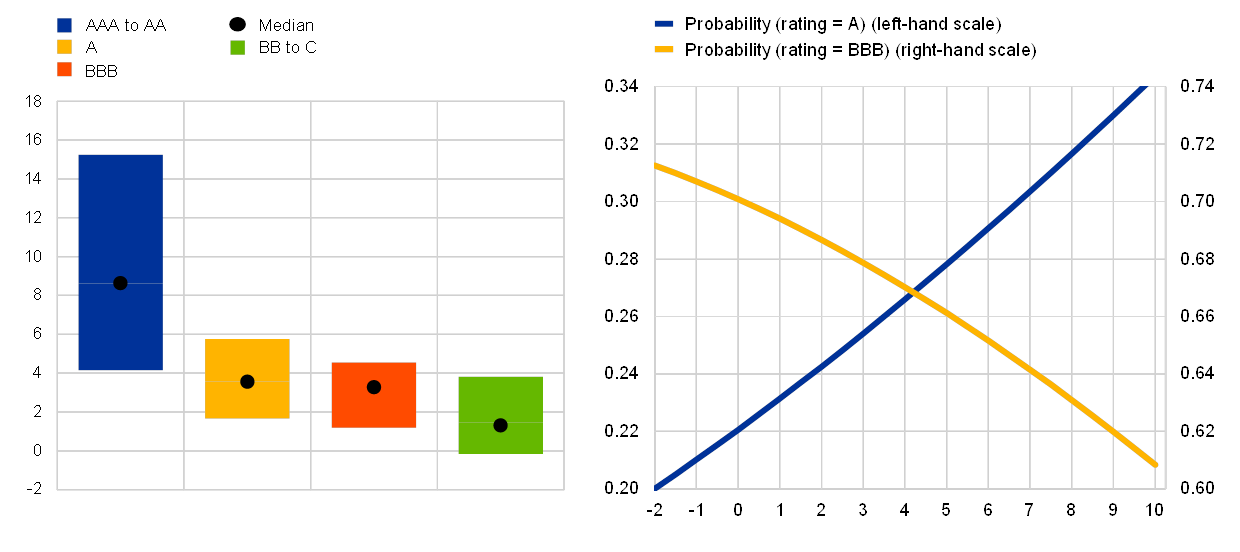
This box estimates the impact of a bank’s management capital buffer on its credit rating. As shown in Chart A (left panel), higher-rated banks tend to have higher management capital buffers than lower-rated banks. To isolate the impact of a bank’s management buffer on its credit rating, an ordered logit model is estimated for more than 150 euro area banks for the period since the first quarter of 2014. The model controls for bank-specific and country-specific variables, as well as country and year fixed effects. A lower credit rating is associated with a higher ordinal value in the ordered logit model.
Chart A
A lower management buffer increases the probability of a bank receiving a lower credit rating
Management buffer distribution across bank ratings and estimated impact of management buffers on ratings
Sources: Fitch, SUP data, SDW and ECB calculations.
Notes: The box plots indicate the interquartile range of the respective samples of bank-quarter observations. The effect of management buffers on rating probabilities is illustrated assuming all other model-factors to be at their median historical values.
The estimated model coefficients reveal that lower management buffers increase the probability of a bank receiving a lower credit rating. For example, assuming all model variables to be at their median values, the probability of receiving a BBB rating increases from around 60% to 70% as management buffers decrease from 10% to 0% (see Chart A, right panel). Other bank factors also have an impact on a bank’s credit rating: a higher pre-tax ROA and a larger bank size reduce the probability of a low credit rating, while a higher NPL ratio and higher capital requirements (Pillar 1 requirements + P2R + and also including P2G) increase this probability. In terms of macro factors, a higher government bond spread, a larger government debt-to-GDP ratio, and a higher unemployment rate all increase the probability of a low credit rating. A higher banking sector credit-to-GDP ratio and a higher level of real GDP per capita both decrease the probability of a low credit rating. All estimated coefficients, with the exception of the unemployment rate are statistically significant at least at the 10% level.
The model performs quite well historically in explaining bank credit ratings based on the set of bank-specific and country-specific variables. The pseudo R-squared of the model is 48%, meaning that for the period since the first quarter of 2014 around half of the credit rating variability across euro area banks is explained by the model. The good model fit can also be seen from the fact that at the current end of the sample banks that are rated in a specific rating bucket are often assigned the highest probability to be rated in that specific bucket by the model (see Chart 5 in the main text, left panel).
4 Conclusion
This article discusses how financial market pressure can be an impediment to capital buffer usability. Regulatory capital releases lower banks’ target CET1 ratios. This in itself would create space for banks to expand their balance sheets, support lending and absorb future losses. However, at present, banks seem unwilling to adjust fully, if at all, to the recent buffer releases. Moreover, past regularities show that banks tend instead to raise their target CET1 ratio when faced with an adverse economic and financial environment, offsetting the expansionary effect of buffer releases.
Pressure from financial markets can explain this behaviour. Adverse and uncertain periods are characterised by low risk appetite and flight to safety among investors in bank debt and equity. Hence, banks may refrain from using their capital buffers in order to avoid potential increases in credit risk premia embedded in their funding costs. Lower-rated banks in particular may be concerned about their ability to access wholesale funding markets if they let their buffers shrink. Moreover, banks appear concerned about the future replenishing of their regulatory capital ratios: in a context of structurally weak profitability and limited ability to accumulate capital organically, a rapid rise in capital requirements could trigger unintended regulatory breaches and therefore restrictions on distributions to shareholders, AT1 bondholders and management remuneration. Finally, their current low valuations may further reduce banks’ willingness to dip into buffers, as this could further deteriorate metrics of bank risk based on market prices which are used by financial market investors. Nevertheless, it may be too early to draw conclusions on the degree to which banks are willing to use their buffers, because losses have been prevented or delayed and lending has been supported by other broad-based policy measures beyond prudential policies. So far, these policies have alleviated the need to reduce capital targets, while still being able to accommodate loan demand.
References
Aymanns, C., Caceres, C., Daniel, C. and Schumacher, L.B. (2016), “Bank Solvency and Funding Cost”, IMF Working Paper, No 16/64.
Arnould, G., Pancaro, C. and Żochowski, D. (2020), “Bank funding costs and solvency”, Staff Working Paper, No 853, Bank of England.
Babihuga, R. and Spaltro, M. (2014), “Bank Funding Costs for International Banks”, IMF Working Paper, No 14/71.
BCBS (2015), “Making supervisory stress tests more macroprudential: Considering liquidity and solvency interactions and systemic risk”, Working Paper, No 29, Basel Committee on Banking Supervision.
Behn, M., Rancoita, E. and Rodriguez d’Acri, C. (2020), “Macroprudential capital buffers – objectives and usability”, Macroprudential Bulletin, No 11, ECB.
Borsuk, M., Budnik, K., Volk, M. (2020), “Buffer use and lending impact analysis”, Macroprudential Bulletin, No 11, ECB.
Dent, K., Hacioglu Hoke, S. and Panagiotopoulos, A. (2017), “Solvency and wholesale funding cost interactions at UK banks”, Staff Working Paper, No 681, Bank of England.
Elyasiani, E. and Keegan, J. (2017), “Market Discipline in the Secondary Bond Market: The Case of Systemically Important Banks”, Working Papers, No 17-5, Federal Reserve Bank of Philadelphia.
Gambacorta, l. and Shin, H.S. (2018), “Why bank capital matters for monetary policy”, Journal of Financial Intermediation, Vol. 35, pp. 17-29.
Gilchrist, S. and Mojon, B (2016), “Credit Risk in the Euro Area”, The Economic Journal, Vol. 128, pp. 118-158.
Haldane, A.G. and Madouros, V. (2012), “The Dog and the Frisbee”, Federal Reserve Bank of Kansas City’s economic policy symposium on The Changing Policy Landscape, August.
Hasan, I., Liu, L. and Zhang, G. (2016), “The Determinants of Global Bank Credit-Default-Swap Spreads”, Journal of Financial Services Research, Vol. 50, p. 275-309.
Schmitz, S., Sigmund, M. and Valderrama, L. (2017), “Bank Solvency and Funding Cost: New Data and New Results”, IMF Working Paper, No 17/116.
The transition to IFRS 9 standards typically results in lower CET1 ratio due to forward looking Expected Credit Losses (ECL). To ensure a smooth transition, during phase-in period, banks can partially offset the impact of the ECL. Given the procyclical nature of ECL, their implementation could have resulted in a material reduction in banks CET1 ratio during the COVID crisis. To mitigate this potential negative impact on banks’ lending capacity, the phase-in period has been extended, reducing the impact of ECL on CET1 ratios. See the Regulation of the European Parliament and of the Council amending Regulations (EU) No 575/2013 and (EU) 2019/876 as regards adjustments in response to the COVID‑19 pandemic.
Directive 2013/36/EU, Articles 102, 104, 141& 142.
We focus on the 39 largest banks that published an internal target CET1 ratio before the COVID-19 crisis and had also published results for the first quarter of 2020 by early September 2020.
This does not include banks that withdrew their targets without announcing new ones.
Meaning that banks may not be present in all quarters of the sample period, some of them enter in or exiting the sample in the meantime.
4.5% CET1 core requirements, shortfalls in AT1 and T2 requirements to be covered with CET1, P2R and the potential additional constraint from the leverage ratio when it binds more than capital requirements expressed in risk-weighted assets (RWA), in particular when risk weights are low.
At the bank level, total RWA and average risk weight; at the country level, the size (total asset as a ratio of GDP) and concentration of the banking sector (Herfindahl index) and trade openness.
The annex contains additional information about the empirical studies reviewed here. Importantly, studies differ with respect to how funding costs and solvency are measured.
For example, ownership structure matters too, with cooperative banks and other non-listed banks not being exposed to short-term pressure originating from the equity market.
That said, so far rating agencies have rarely gone beyond putting banks on negative watch. In a sample of 25 large listed banks investigated in the analysis of market-implied ratings, no downgrades of senior unsecured ratings (by Moody’s) have been observed since the end of 2019, and only one bank is no longer rated. A recent study by S&P reveals that rating agencies are willing to tolerate buffer use as long as it is reasonable to assume that buffers would be rebuilt and this would not lead to permanently lower capital ratios.
Apart from one instance for senior preferred bonds at less favourable conditions.
Under the central scenario of the ECB’s vulnerability analysis, CET1 capital ratios are projected to decline by 1.9 percentage points between 2019 and 2022.
See Haldane and Madouros (2012).


